CW NMR/ESR Spectrometer (NOT CURRENTLY AVAILABLE)


CW NMR/ESR Spectrometer (NOT CURRENTLY AVAILABLE)
TEL-CWS12-50
Spin is a basic property of nuclei and electrons. Although spin cannot be measured directly, the magnetic dipole moment is closely related and can be observed. This experiment uses the basic setup developed by Felix Bloch, for which he won the 1952 Nobel prize.
Measure NMR/ESR line width
Determine g factor
Study line shape
TEL-CWS12-50
Spin is a basic property of nuclei and electrons. Although spin cannot be measured directly, the magnetic dipole moment is closely related and can be observed. This experiment is similar to that developed by Felix Bloch, for which he won the 1952 Nobel prize.
Measure NMR/ESR line width
Determine g factor
Study line shape
This experiment measures the rf radiation absorbed and re-emitted by the nuclear spins in the sample flipping in the applied magnetic field. This experiment is a great way to connect physics to the real world as NMR is the basis for MRI. Students can perform a simple experiment to measure the gyromagnetic ratio of hydrogen or fluorine, or a more complicated experiment comparing the line shapes of solid and liquid samples.
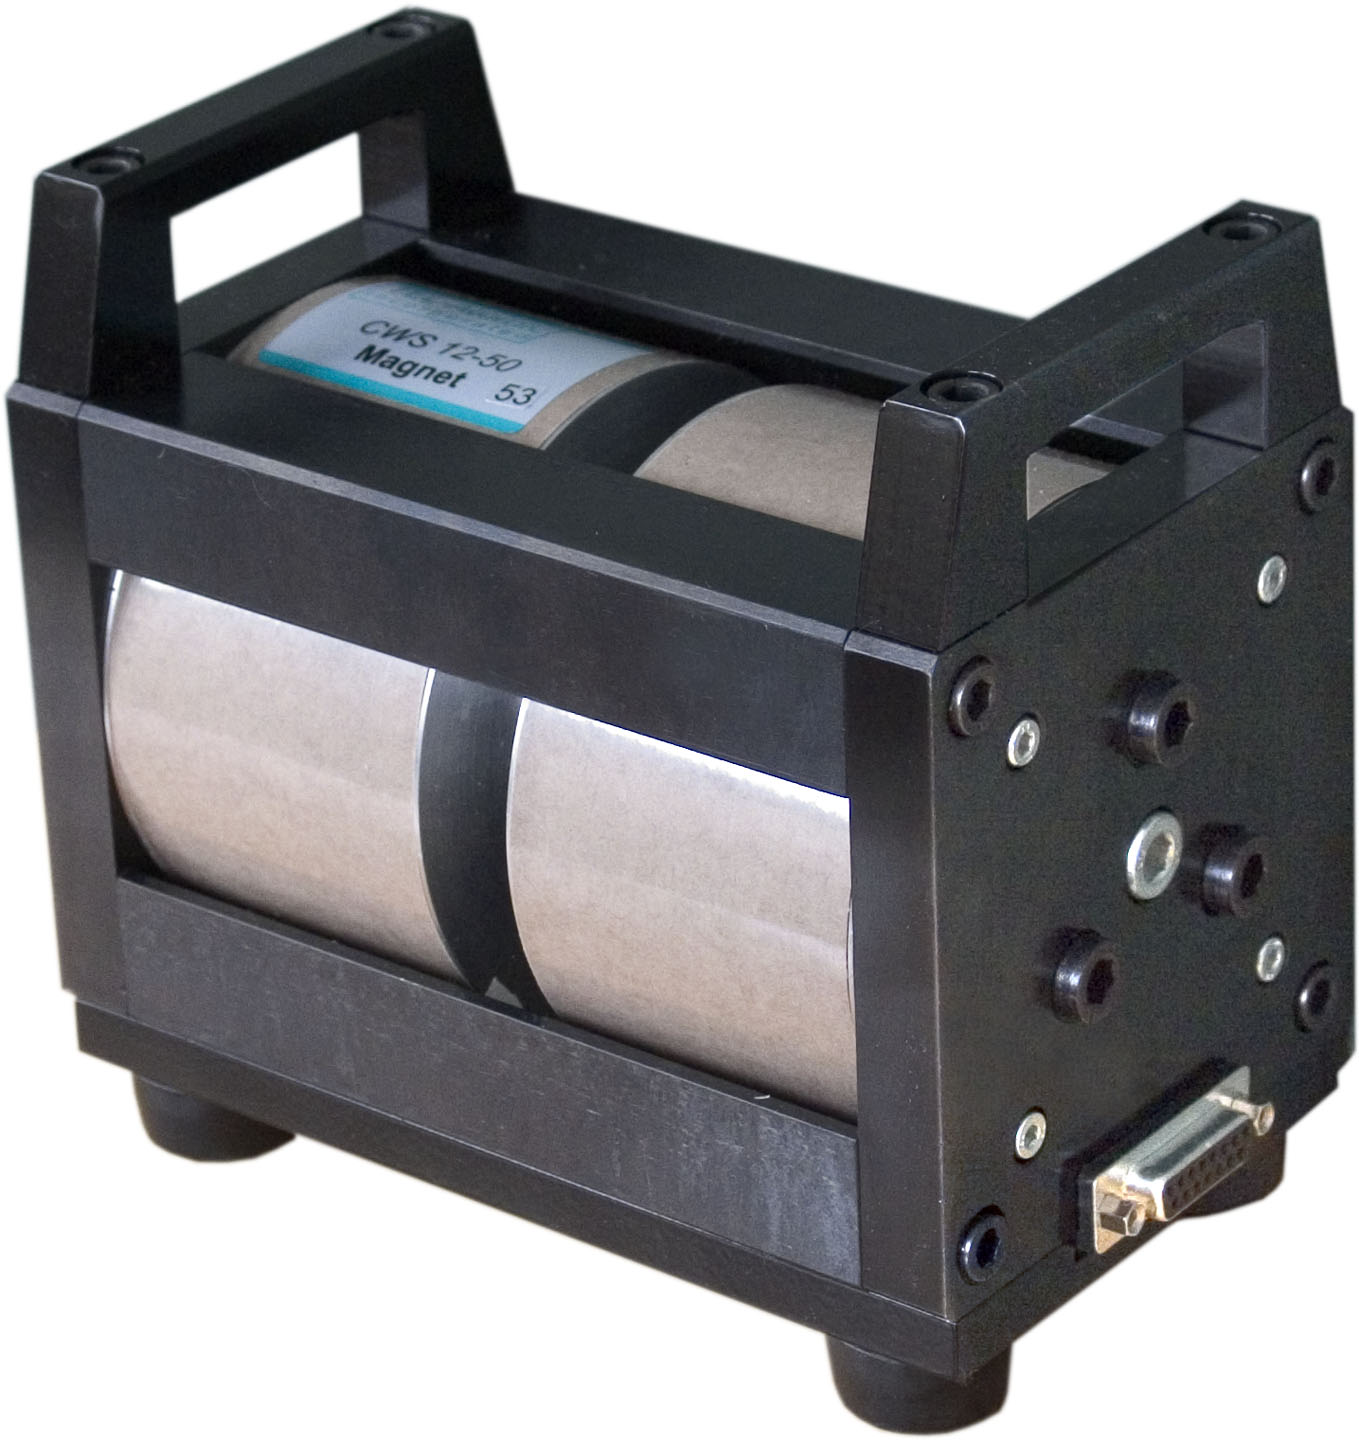
Electron spin resonance, also known as electron paramagnetic resonance, is analogous to NMR, but operating on unpaired electrons, not on nuclei. Electrons have a larger magnetic moment than nuclei, and therefore have a higher gyromagnetic ratio. Only a small magnetic field is required to create the resonance. A set of Helmholtz coils are all that is needed to provide the field, and the field is small enough that the earth’s magnetic field is a significant component of the net field on the electrons. This means that students can measure Earth’s magnetic field by rotating the experiment.
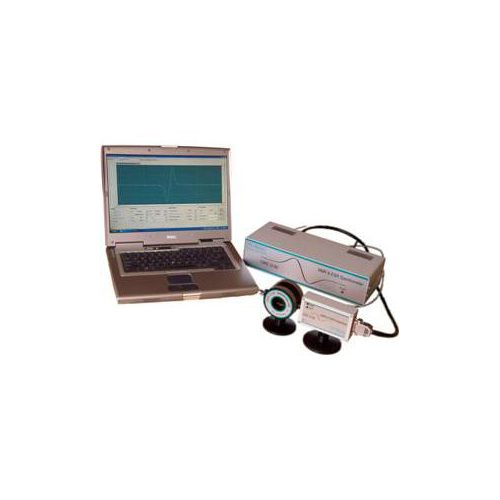
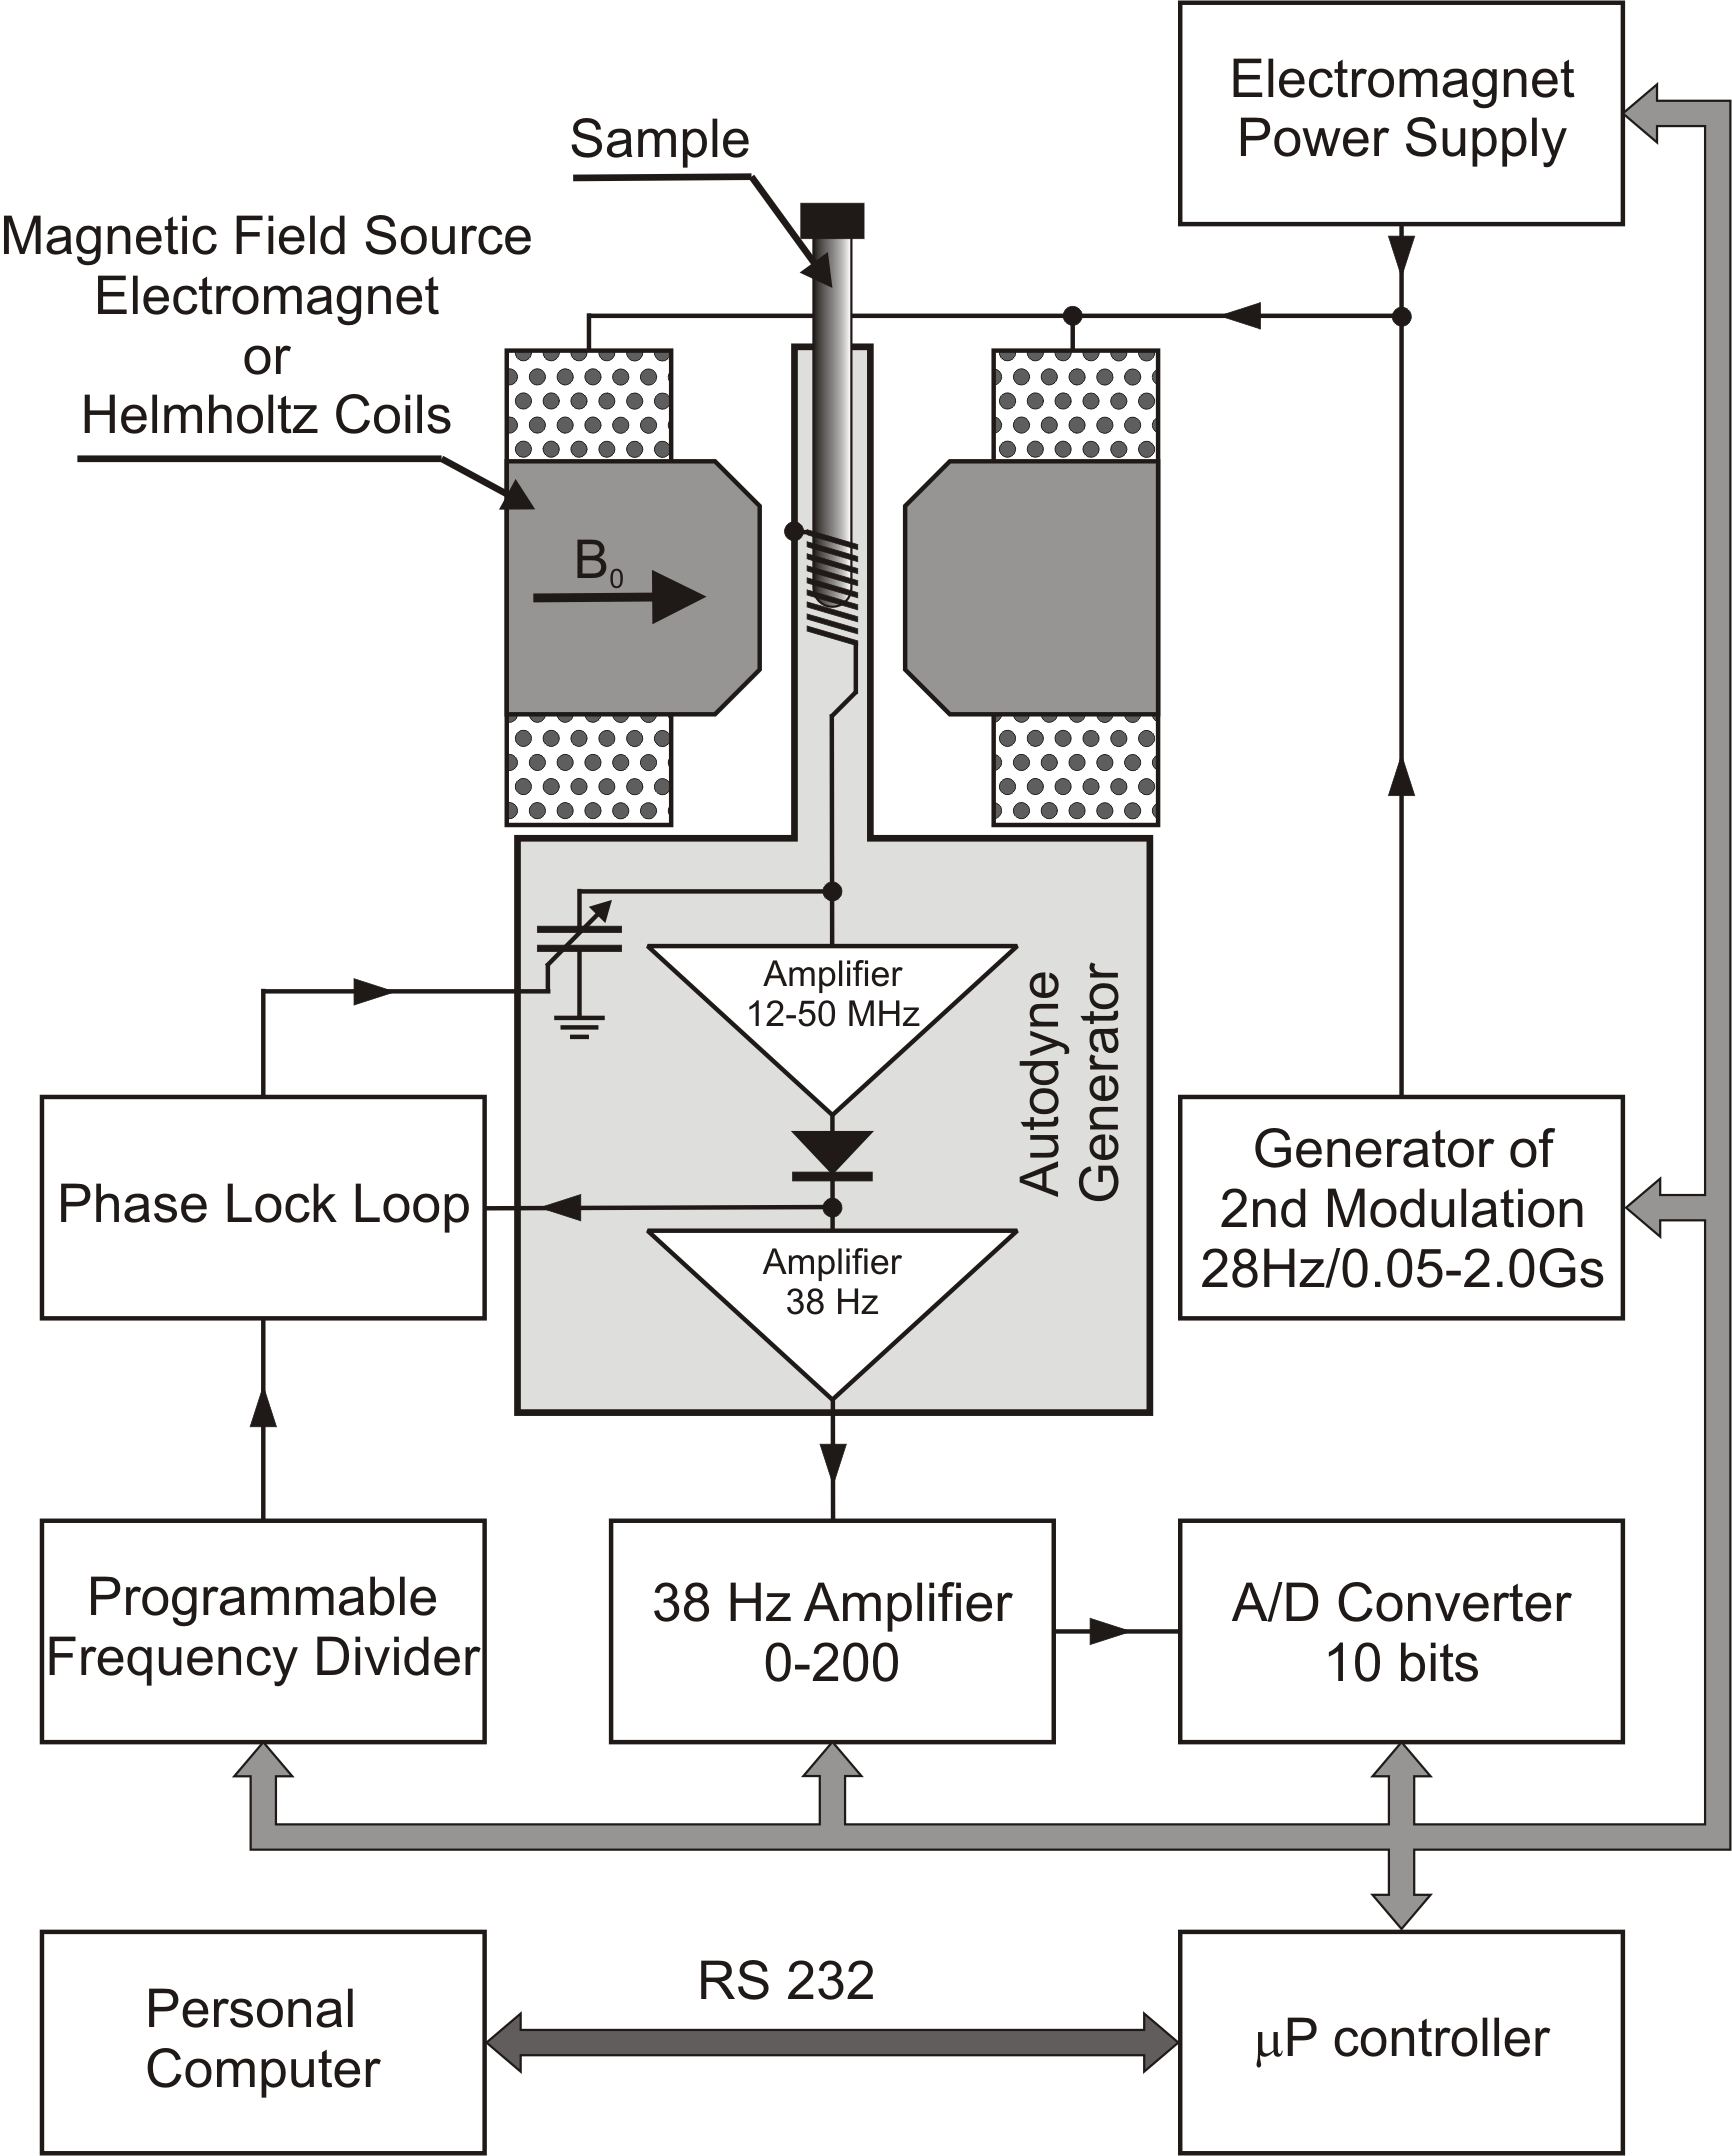
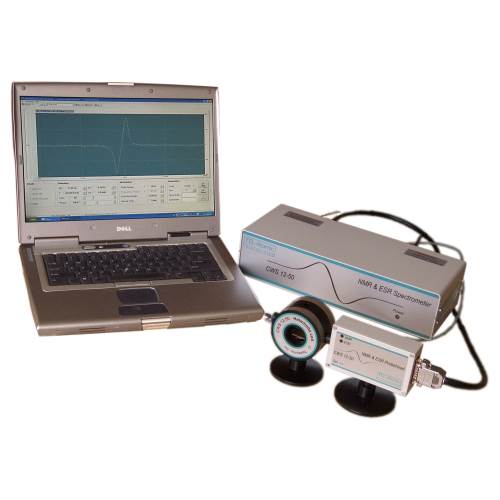
The TEL-CWS12-50 NMR/ESR unit needs no additional accessories, only a computer. The software for controlling the program is included. Since the unit itself connects to the computer no additional equipment such as an oscilloscope or computer interface is required.
The software allows complete computer control of all parameters, provides for a cursor read out of the data as well as the ability to zoom in on a region of interest. Experimental parameters are selected in a set-up page that can be saved for future data acquisition. A further processing page allows the user to process the data. One can integrate the 1st derivative to obtain an absorption line. The absorption line can be integrated within limits set by the user. In addition calculations of the 2nd and 4th moment can be performed. The line width of the 1st derivative or absorption line can also be calculated. This data can then be saved, exported or printed.
Data can be accumulated in a single run or in several runs thus providing a better signal-noise ratio for weak signals.
The user can vary the magnetic field and frequency of a sweep, adjust the receiver gain and the phase of the detector reference signal, and select the time for a single sweep. Data can be acquired in one or over a number of sweeps. The user can choose to display on the screen the last 5 sweeps in different colors.
An Operations/Experimental manual on CD gives detailed instructions on how to use the software as well as providing directions for performing several NMR/ESR Experiments.
